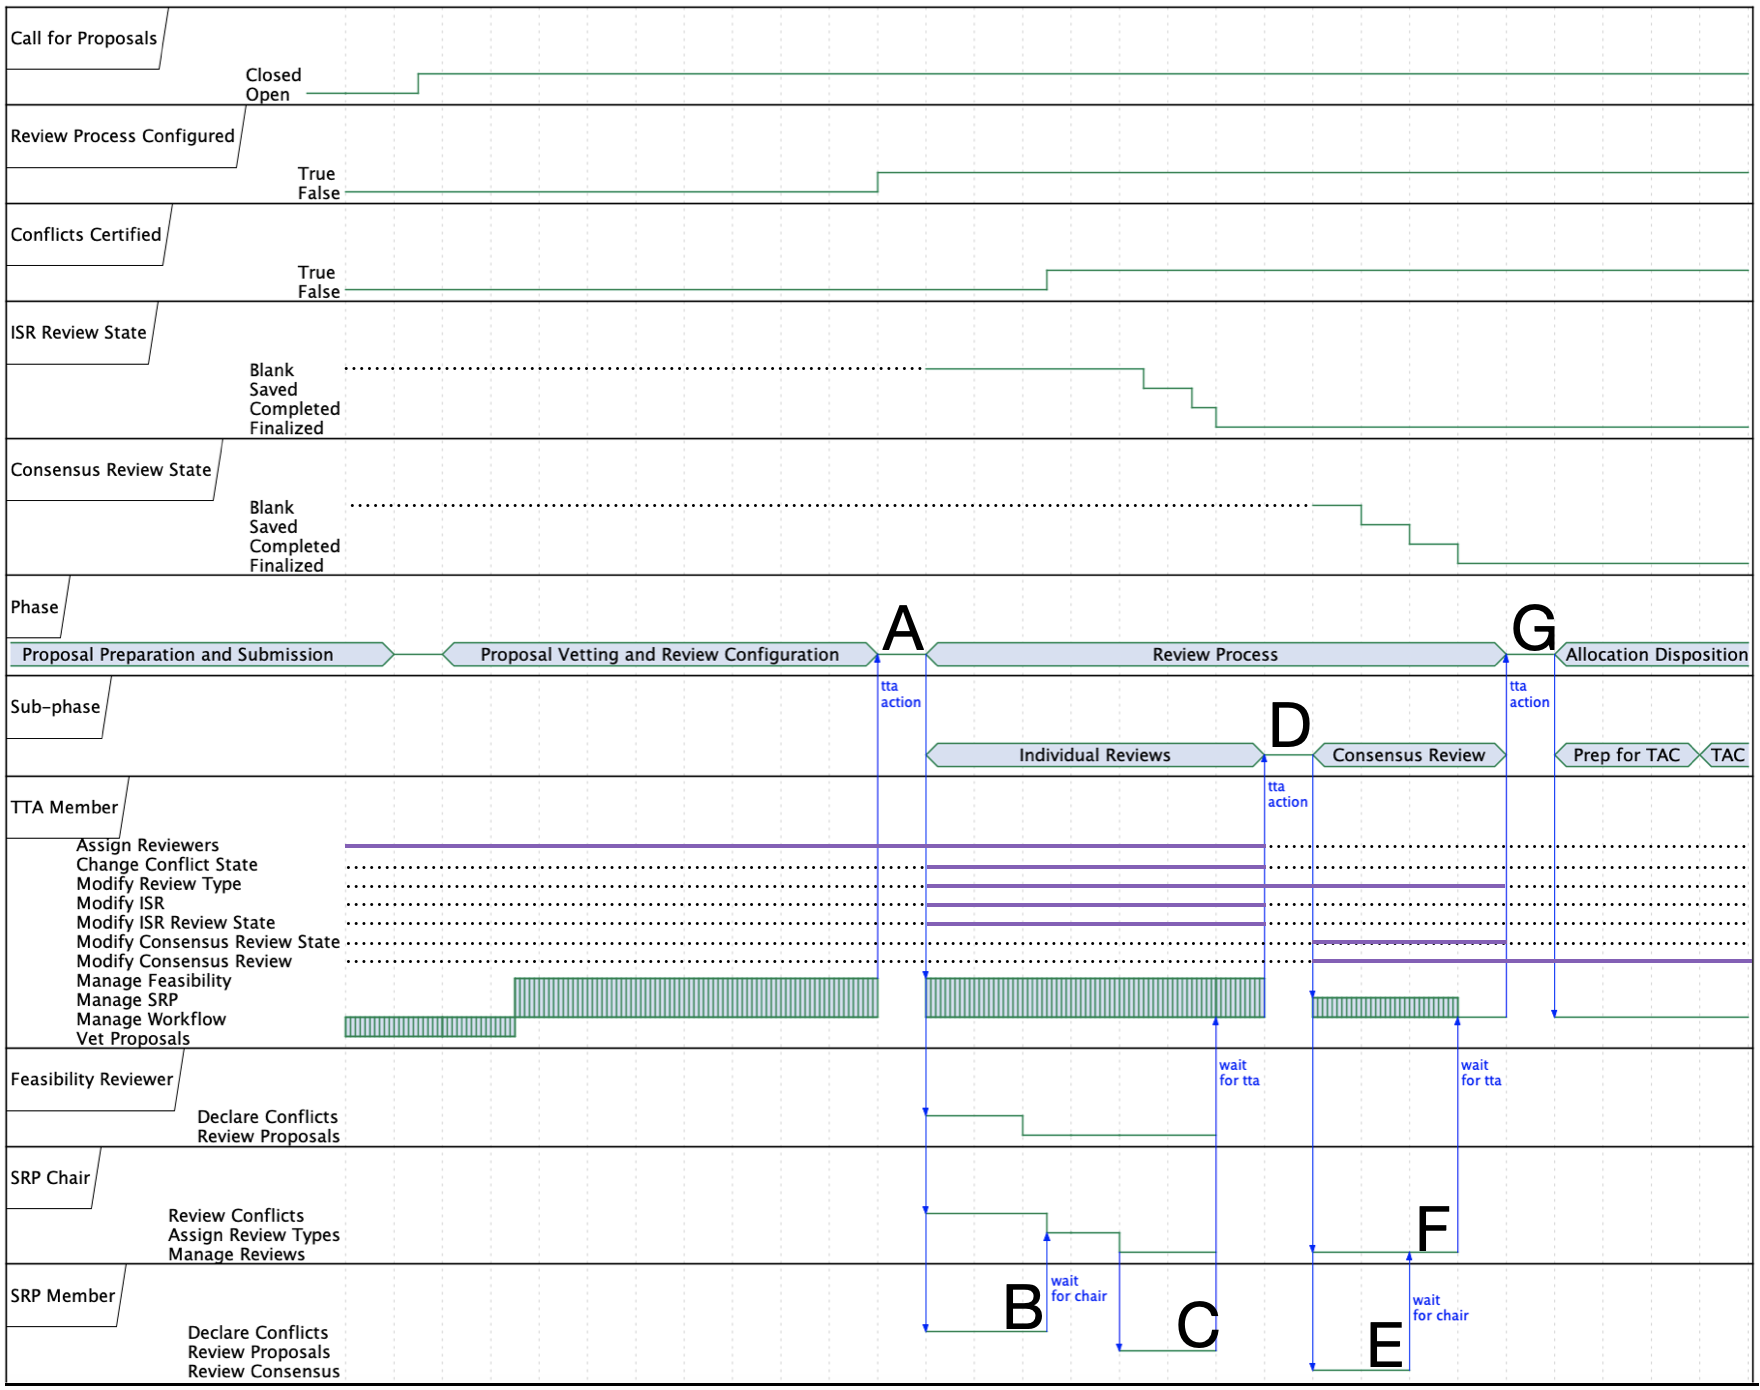
The top two rows show key properties that account for progress or transitions in the process.
The third row illustrates the relationship between a SRP member's workflow and Conflict Declaration.
The fourth row is an example of an ISR's Review State.
The fifth row is an example of a Proposal's Consensus Review State.
The sixth row is the phase of the Proposal Process; the seventh is the sub-phase, if applicable.
The eighth row shows the TTA member's workflow through the Proposal Process. A select set of actions is shown, where a solid purple line indicates the TTA member can perform the action. A dotted black line indicates the action is forbidden.
A single Feasibility Reviewer's, SRP Chair's, SRP Chair's general tasks are shown in rows nine through ten, respectively.
The bold letters indicate important actions a TTA member, SRP member, or SRP Chair must take to advance the system: (A) a TTA member finalizes the Review Configuration; (B) a SRP member certifies their conflicts; (C) a SRP member finalizes their ISRs; (D) a TTA member initiates Consensus sub-phase on a per panel basis; (E) a SRP member completes the Consensus Reviews; (F) a SRP Chair finalizes Consensus Reviews; (G) a TTA member closes the Review Process phase by generating the NLR Scores.